It started with a simple question: can I see my air conditioning temperature history on a nice chart? What followed was a rabbit hole that led me from Grafana dashboards to running a full Home Assistant setup on a Raspberry Pi.
The Initial Idea
I have a Samsung air conditioner that connects to the SmartThings app. The app works fine for controlling the AC, but it doesn't give you any historical data. I wanted to see temperature trends over time—when does the AC kick in most often? How does outdoor temperature affect indoor climate? Basic stuff that the app simply doesn't provide.
So I started googling. How do you get data out of SmartThings? How do you visualize it? And that's when I found this post on the SmartThings community—someone had already figured out how to pipe SmartThings data into InfluxDB and display it in Grafana.
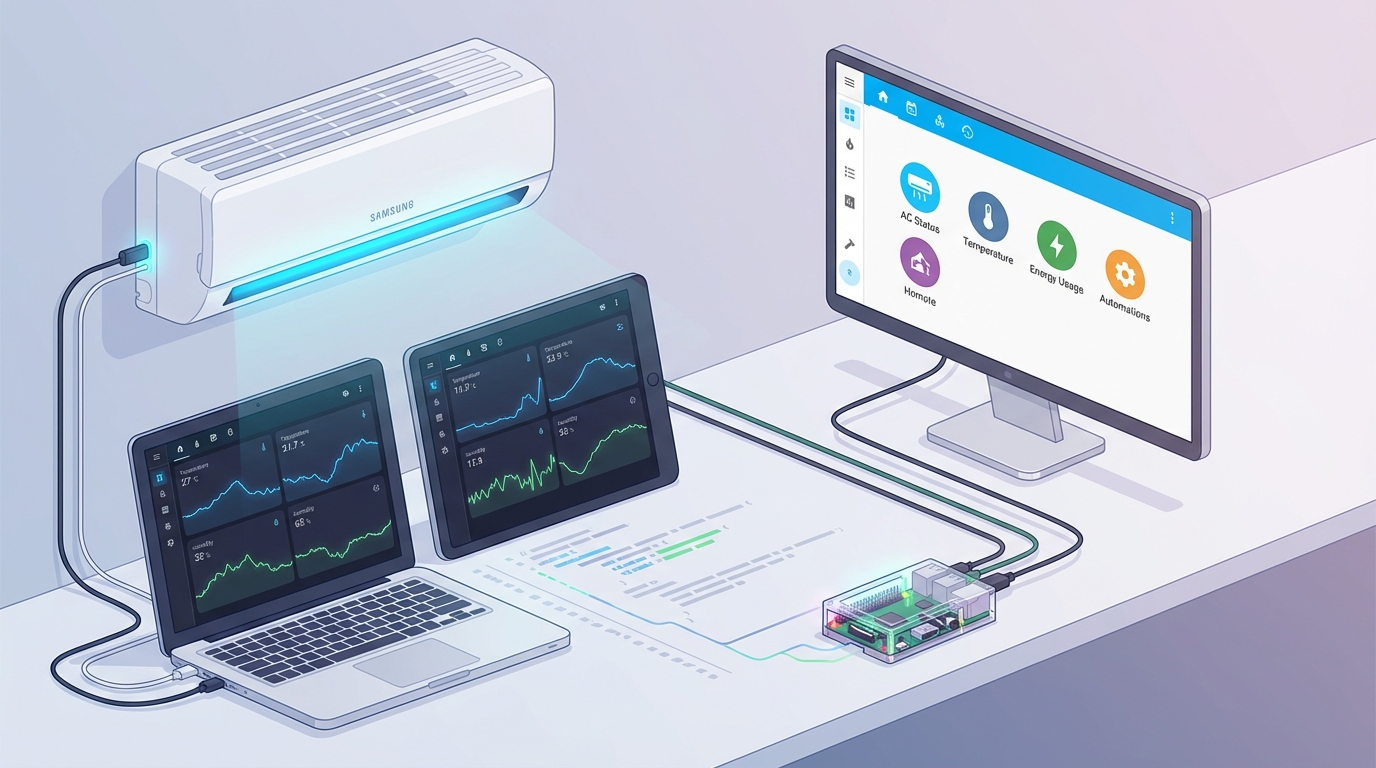
Setting Up the Raspberry Pi
I ordered a Raspberry Pi 4B. A few days later, I had it running with:
- Raspberry Pi OS
- InfluxDB for time-series data storage
- Grafana for visualization
- A custom script to pull data from SmartThings API
After some configuration, I had my first dashboard. Temperature readings, humidity levels, AC state (on/off), power consumption—all updating in real time. It was satisfying to finally see the data I'd been curious about.
The Problem with Custom Scripts
The setup worked, but it was fragile. The SmartThings API would occasionally change, breaking my scripts. Authentication tokens expired. The whole thing required maintenance I didn't want to deal with.
I kept hearing about Home Assistant—an open-source home automation platform. People said it "just works" with Samsung SmartThings. I was skeptical, but decided to try it.
Migrating to Home Assistant
I wiped the Pi and installed Home Assistant OS. The setup was surprisingly smooth:
- Flash the Home Assistant image to SD card
- Boot the Pi and wait for initialization
- Access the web interface and create an account
- Add the SmartThings integration—just OAuth login, done
Within 30 minutes, all my Samsung devices were showing up in Home Assistant. No custom scripts. No API wrangling. It just... worked.
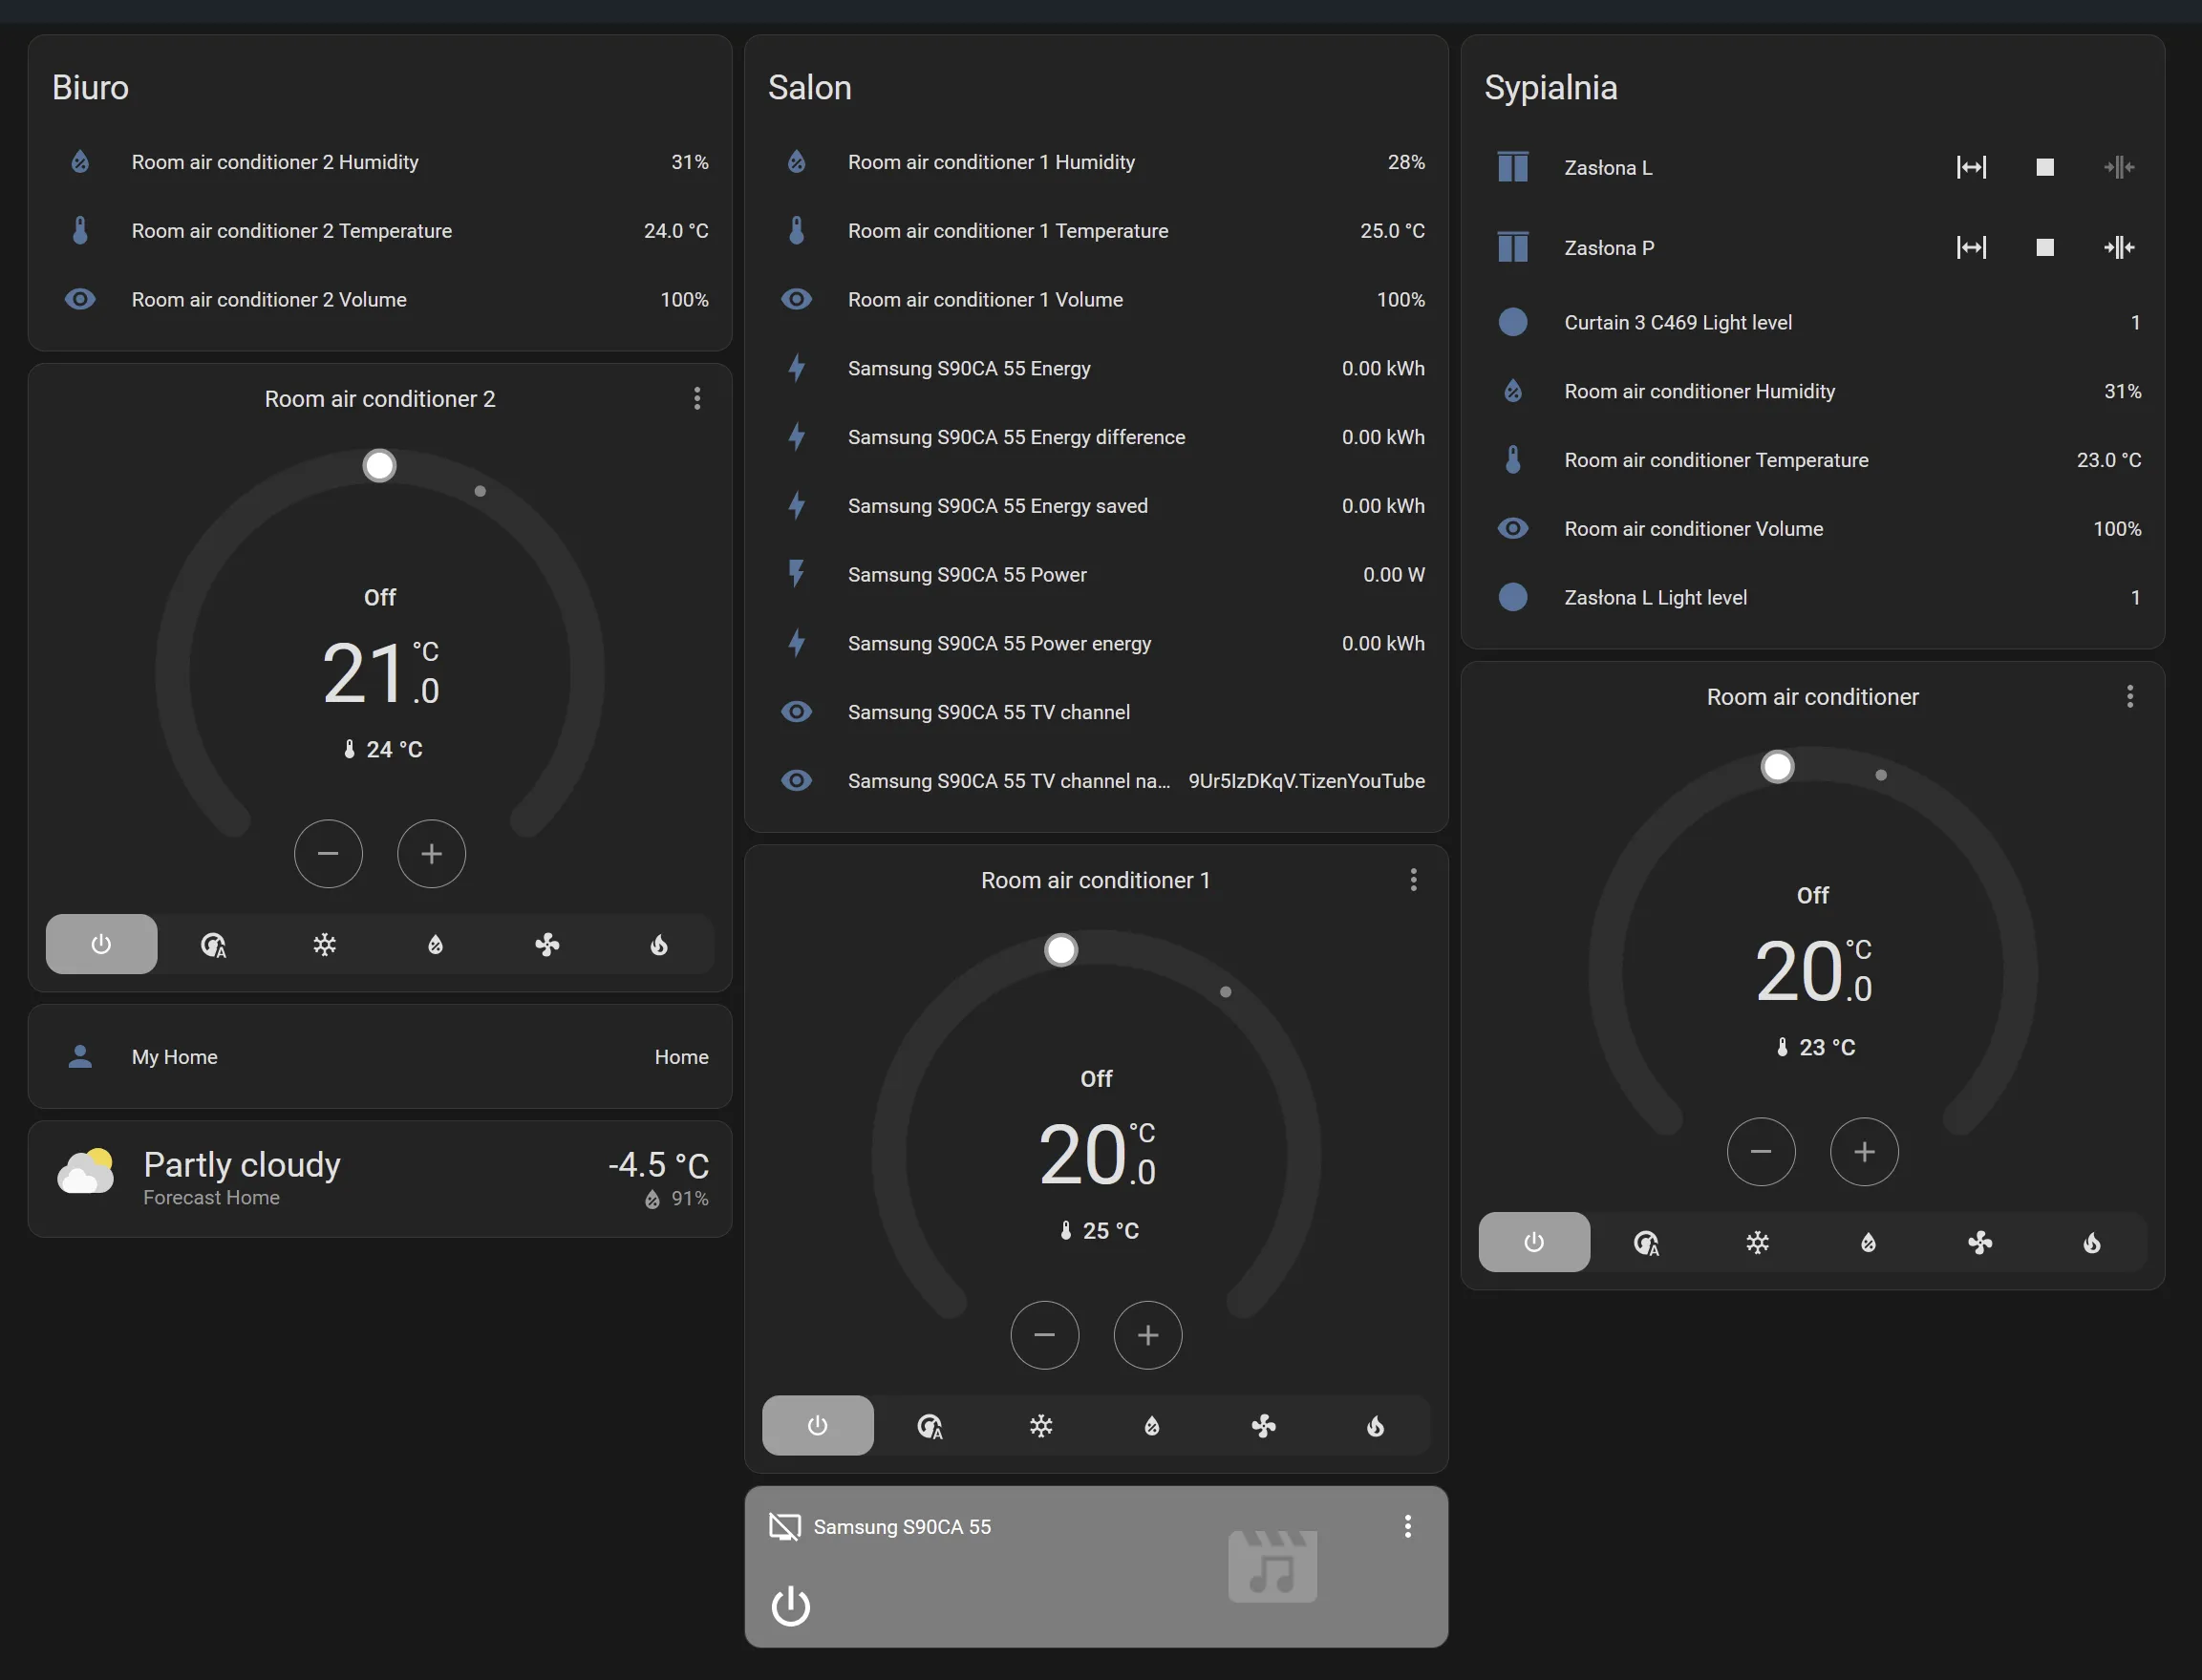
What I Gained
Home Assistant gave me way more than I expected:
- Built-in history and graphs — No need for separate InfluxDB/Grafana setup (though you can still add them if you want)
- Automations — Turn on AC when temperature exceeds threshold, send notifications when humidity is too high
- Energy monitoring — Track power consumption over time
- Other integrations — I've since added smart plugs, lights, and sensors
What started as "I want a temperature chart" turned into a proper smart home setup.
Lessons Learned
Sometimes the custom solution isn't the best solution. I spent hours writing scripts and debugging API issues when a mature platform already solved the problem.
That said, the Grafana detour wasn't wasted time. I learned about time-series databases, data visualization, and the SmartThings ecosystem. When I eventually added Grafana back to Home Assistant (for more advanced dashboards), I already knew how to use it.
Start with the simplest solution that might work. You can always add complexity later.
If you're looking to monitor your Samsung AC (or any SmartThings device), skip the custom scripts and go straight to Home Assistant. Your future self will thank you.